What is Measures of Dispersion?
Measures of dispersion measure how spread out a set of data is.
Variance and Standard Deviation
The formulae for the variance and standard deviation are given below. m means the mean of the data.
| Variance | = | s2 | = | S (xr - m)2 |
n
|
The standard deviation, s, is the square root of the variance.
What the formula means:
(1) xr - m means take each value in turn and subtract the mean from each value.
(2) (xr - m)2 means square each of the results obtained from step (1). This is to get rid of any minus signs.
(3) S(xr - m)2 means add up all of the results obtained from step (2).
(4) Divide step (3) by n, which is the number of numbers
(5) For the standard deviation, square root the answer to step (4).
Example
Find the variance and standard deviation of the following numbers: 1, 3, 5, 5, 6, 7, 9, 10 .
The mean = 46/ 8 = 5.75
(Step 1): (1 - 5.75), (3 - 5.75), (5 - 5.75), (5 - 5.75), (6 - 5.75), (7 - 5.75), (9 - 5.75), (10 - 5.75)
= -4.75, -2.75, -0.75, -0.75, 0.25, 1.25, 3.25, 4.25
= -4.75, -2.75, -0.75, -0.75, 0.25, 1.25, 3.25, 4.25
(Step 2): 22.563, 7.563, 0.563, 0.563, 0.063, 1.563, 10.563, 18.063
(Step 3): 22.563 + 7.563 + 0.563 + 0.563 + 0.063 + 1.563 + 10.563 + 18.063
= 61.504
= 61.504
(Step 4): n = 8, therefore variance = 61.504/ 8 = 7.69 (3sf)
(Step 5): standard deviation = 2.77 (3sf)
Adding or Multiplying Data by a Constant
If a constant, k, is added to each number in a set of data, the mean will be increased by k and the standard deviation will be unaltered (since the spread of the data will be unchanged).
If the data is multiplied by the constant k, the mean and standard deviation will both be multiplied by k.
Grouped Data
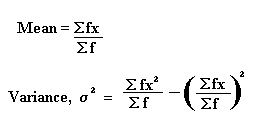
There are many ways of writing the formula for the standard deviation. The one above is for a basic list of numbers. The formula for the variance when the data is grouped is as follows. The standard deviation can be found by taking the square root of this value.

Example
The table shows marks (out of 10) obtained by 20 people in a test
| Mark (x) | Frequency (f) |
| 1 | 0 |
| 2 | 1 |
| 3 | 1 |
| 4 | 3 |
| 5 | 2 |
| 6 | 5 |
| 7 | 5 |
| 8 | 2 |
| 9 | 0 |
| 10 | 1 |
Work out the variance of this data.
In such questions, it is often easiest to set your working out in a table:
| fx | fx2 |
| 0 | 0 |
| 2 | 4 |
| 3 | 9 |
| 12 | 48 |
| 10 | 50 |
| 30 | 180 |
| 35 | 245 |
| 16 | 128 |
| 0 | 0 |
| 10 | 100 |
Sf = 20
Sfx = 118
Sfx2 = 764
Sfx = 118
Sfx2 = 764
variance = Sfx2 - ( Sfx )2
Sf ( Sf )2
= 764 - (118)2
20 ( 20 )2
= 38.2 - 34.81 = 3.39
Sf ( Sf )2
= 764 - (118)2
20 ( 20 )2
= 38.2 - 34.81 = 3.39
Quartiles
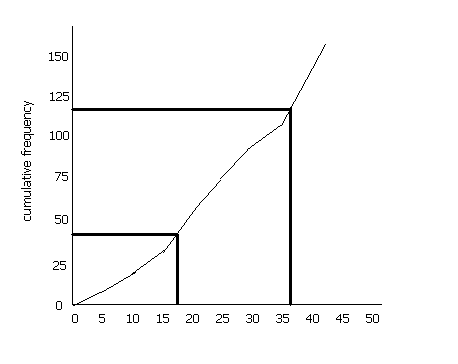
If we divide a cumulative frequency curve into quarters, the value at the lower quarter is referred to as the lower quartile, the value at the middle gives the median and the value at the upper quarter is the upper quartile.
A set of numbers may be as follows: 8, 14, 15, 16, 17, 18, 19, 50. The mean of these numbers is 19.625 . However, the extremes in this set (8 and 50) distort the range. The inter-quartile range is a method of measuring the spread of the numbers by finding the middle 50% of the values.
It is useful since it ignore the extreme values. It is a method of measuring the spread of the data.
The lower quartile is (n+1)/4 th value (n is the cumulative frequency, i.e. 157 in this case) and the upper quartile is the 3(n+1)/4 the value. The difference between these two is the inter-quartile range (IQR).
In the above example, the upper quartile is the 118.5th value and the lower quartile is the 39.5th value. If we draw a cumulative frequency curve, we see that the lower quartile, therefore, is about 17 and the upper quartile is about 37. Therefore the IQR is 20 (bear in mind that this is a rough sketch- if you plot the values on graph paper you will get a more accurate value).

No comments:
Post a Comment